Preserve Infrastructure

Infrastructure Performance Measures
Historical Infrastructure Index

In 2019, the methods for this calculation were changed to indicate the condition of the assets instead of how well the asset condition targets were met.

Infrastructure Index


Infrastructure Performance Measures

  [X]
Key Points
  • Current funding levels are projected to be adequate to maintain the high volume roadways in acceptable condition for the next several years.
  • Low volume road funding is accomplishing the needed improvements in pavement conditions.
  • Smart investment in rehabilitation and preservation of UDOT's pavements results in cost savings to the Department by extending the life of UDOT's highest value asset
  [X]
Pavement Strategies

Improve the pavement condition of our road network by implementing recommendations that are closely aligned with the dTIMS model and optimizing the model to reflect the current conditions and usage of our roads.

Replace an equivalent year of pavement each year on the system.

Pavement

These values represent the weighted average condition of high and low volume highways that are in good and fair condition, using the International Roughness Index (IRI), as the indicator.

  [X]
Key Points
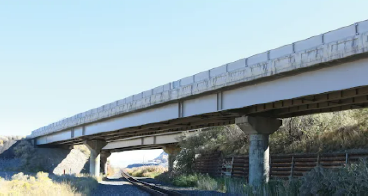
  • Increasing average age of inventory: Before 2000, bridges were typically designed with a design life of 50 years. A significant portion of the state’s bridges were built in the 1960s and 1970s and are nearing the end of their designed service life.
  • Increasing Inventory Size: With new corridors, widenings and new grade separations, the bridge inventory by count and deck area has been steadily growing.
  • High value-bridges: The majority of the state’s large or complex bridges are in fair condition. These bridges represent 4% of bridges by count but 21% by deck area.
  • Funding for local government bridges: To date limited funding has been made available to local agencies to repair or replace aging bridges. New federal funding targets to help these bridges beginning FY22.
  [X]
Bridges Strategies

Create a bridge dashboard to convey state bridge inventory data (e.g. ownership, location, type, span configuration; condition; load posting; historical trends, etc.) based on annual Federal NBI reporting.

Bridges

Bridge Health Index (BHI): The BHI is used as a structural performance measure and is made up of elements (deck, parapets, joints, overlay, etc.) rolling up to three separate scores (i.e. deck, superstructure, and substructure) that are weighted to underscore the importance of each category in overall bridge health. The element level evaluation is in accordance with the AASHTO Manual for Bridge Element Inspection (MBEI). Bridge condition data is by deck area and based on the annual submittal to FHWA in March in accordance with the Federal NBIS.

  [X]
Key Points
By "communicating"it is meant that a "ping"(or signal) is sent to each device, and the device "pings"(or signals) back. If the communications device is working, that also means there is electric power in the cabinet that houses the device equipment. This measure is a snapshot of devices actively communicating taken at the end of each month, and averaged over each year.
  [X]
ITS Strategies

Improve the operations of our ITS device network by developing an asset program that will help us maintain the system at a good level of health both from a life cycle and technology standpoint.

Intelligent Transportation Systems

This measure shows the percentage of Intelligent Transportation Systems field devices communicating with the Traffic Operations Center (including Closed-circuit Television Devises, Variable Message Signs, Traffic Signals, Ramp Meters, Traffic Monitoring Sensors).

The target is 100%.

  [X]
Key Points
The quantity varies each year as the data is collected manually in the field and each intersection is not evaluated each year.
  [X]
Signals Strategies

Improve service life of signal infrastructure by following upgrade and replacement schedules to maintain a good level of system health.

Signals

These values represent the percent of UDOT traffic signals that are in good, average and poor condition.

The target is 100% in good/fair condition.