Zero Fatalities

Safety Performance Measures
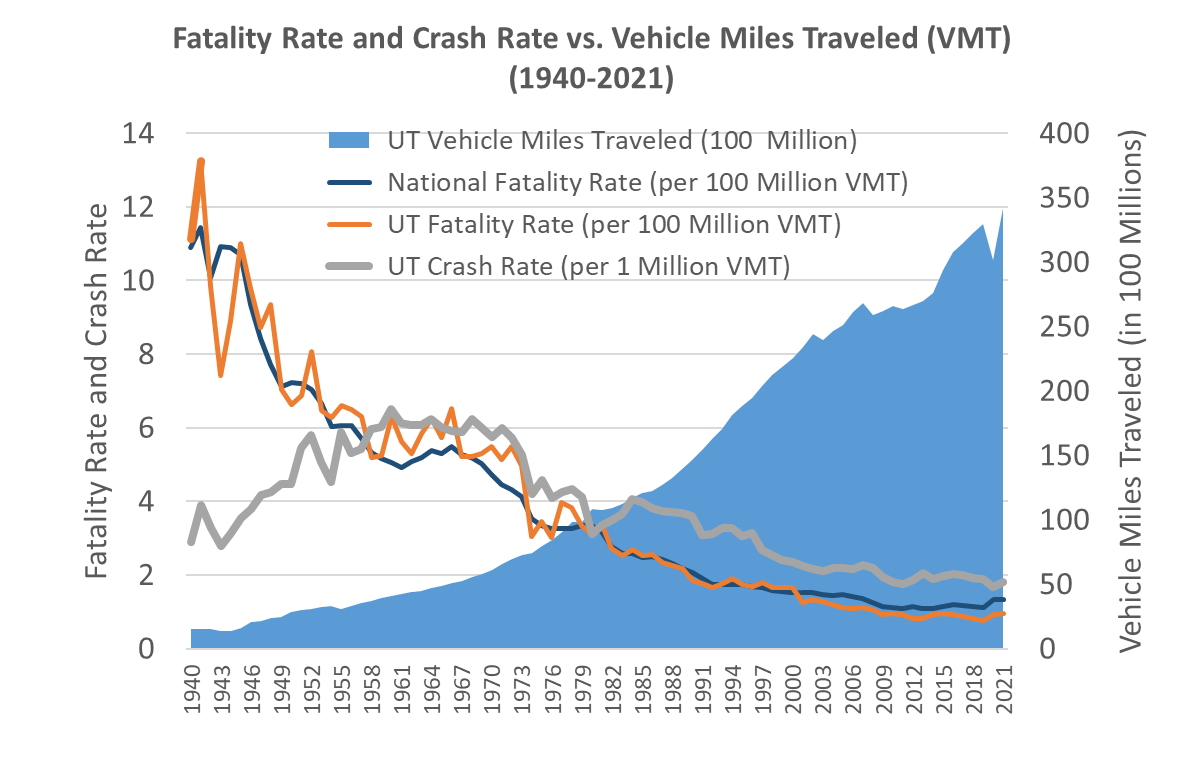
Historical Safety Index
Safety Index
Fatality Rate (per 100M VMT)

Billion VMT Statewide
Graphs current as of


Safety Performance Measures

  [X]
Key Points
Total number of motor vehicles involved fatalities in the state of Utah as reported through law enforcement agencies throughout the state. This data is for all publicly accessible routes. This measure provides a relative indication of progress in reaching our overall goal of Zero Fatalities. The addition of Fatalities per VMT will provide a more complete picture of the factors affecting our fatality numbers each year. The VMT rate will necessarily have some data lag as VMT estimates are produced after the close of each month.
  [X]
Traffic Fatalities Strategies
Implement roadway/lane departure countermeasures.
Implement intersection safety countermeasures that provide maximum protection for roadway users.
Encourage safer driving behaviors through media outreach program.

Traffic Fatalities

Total number of motor vehicle involved fatalities in the state of Utah. This data is for all publicly accessible routes.

Target: Reduce fatality number by 2.5 percent below the three year average.

  [X]
Key Points
Total number of motor vehicle involved suspected serious injuries occurring in the state of Utah. The number of life altering injuries, such as severe laceration, broken or distorted limb, and crush injuries. Suspected serious injuries for the current year are shown as soon as we get the data from law enforcement agencies, but in general we indicate a three month lag to account for the variation in response times from various law enforcement agencies. This data is for all publicly accessible routes.
  [X]
Serious Traffic Injuries Strategies
Implement roadway/lane departure countermeasures.
Implement intersection safety countermeasures that provide maximum protection for roadway users.
Encourage safer driving behaviors through media outreach program.

Suspected Serious Traffic Injuries

Total number of motor vehicle involved suspected serious injuries occurring in the state of Utah. Suspected serious injuries for current year are shown with a one month lag. This data is for all publicly accessible routes.

Target: Reduce by 2.5 percent below the three year average.

  [X]
Key Points
Total number of reported motor vehicle crashes in the state of Utah. The number of crashes for the current year are shown as soon as we get the data from law enforcement agencies, but in general we indicate a three month lag to account for the variation in response times from various law enforcement agencies. This data is for all publicly accessible routes.
  [X]
Traffic Crashes Strategies
Implement roadway/lane departure countermeasures.
Implement intersection safety countermeasures that provide maximum protection for roadway users.
Encourage safer driving behaviors through media outreach program.

Traffic Crashes

Total number of reported motor vehicle involved crashes in the state of Utah. Crashes for current year are shown with a one month lag. This data is for all publicly accessible routes.

Target: Reduce by 2.5 percent below the three year average.

  [X]
Key Points
Rates are a metric used to compare your company's safety performance against a national or state average. This comparison is a safety benchmark to gauge performance with other companies/organizations in the same business group.

UDOT's fatality rate has continued to be ZERO since 2013.
  [X]
Employee Fatalities Strategies
Increase communication of incidents and near misses to improve awareness of safety risks.
  1. Integrate geospatial & live data mapping features
  2. Expand data user community
  3. Focus training on high-frequency trends

Employee Fatalities

The number of UDOT employee deaths.

Target: Achieve zero employee fatalities.

  [X]
Key Points
Rates are a metric used to compare your company's safety performance against a national or state average. This comparison is a safety benchmark to gauge performance with other companies/organizations in the same business group.

The calculated rate is defined as the number of work-related injuries per 100 full-time workers during a one-year period. For example, if an organization's injury rate is 2.0, and the organization has 1700 employees the number of employees that are at risk of experiencing a work related injury/illness is (17*2) or 34 in a one year period. The lower the rate the fewer employees that are at risk, based on injury history.

UDOT continues to experience a reduction in the injury rate year to year. From calendar year 2016 to year end 2020 UDOT had a (32%) reduction. UDOT continues to be focused on continuous improvement efforts as we move towards our goal of ZERO.
  [X]
Employee Injury Rate Strategies
Increase communication of incidents and near misses to improve awareness of safety risks.
  1. Integrate geospatial & live data mapping features
  2. Expand data user community
  3. Focus training on high-frequency trends

Employee Injury Rate

The number of injuries per 200,000 working hours.

Target is set 10% below prior year injury rate.

  [X]
Key Points
Rates are a metric used to compare your company's safety performance against a national or state average. This comparison is a safety benchmark to gauge performance with other companies/organizations in the same business group.

The calculated rate is defined as the number of equipment damage per 100 full-time workers during a one-year period. For example, if an organization's equipment rate is 2.0, and the organization has 1700 employees the number of employees that are at risk of being involved in accident involving equipment/vehicles is (17*2) or 34 in a one year period. The lower the rate the fewer employees that are at risk. This metric is important to measure and take action on, because there is a high probability that injury can occur when equipment is involved.

Equipment damage continues to be an area that UDOT struggles to improve in. Over the past 2.5 years the rate has slightly increased.
  [X]
Equipment Damage Strategies
Increase communication of incidents and near misses to improve awareness of safety risks.
  1. Integrate geospatial & live data mapping features
  2. Expand data user community
  3. Focus training on high-frequency trends

Equipment Damage Rate

The number of incidents of equipment damage per 200,000 working hours.

Target: Achieve a rate of 6.85 incidents per 200,000 working hours.